ANALYTICS & OPERATIONS
MediaNet
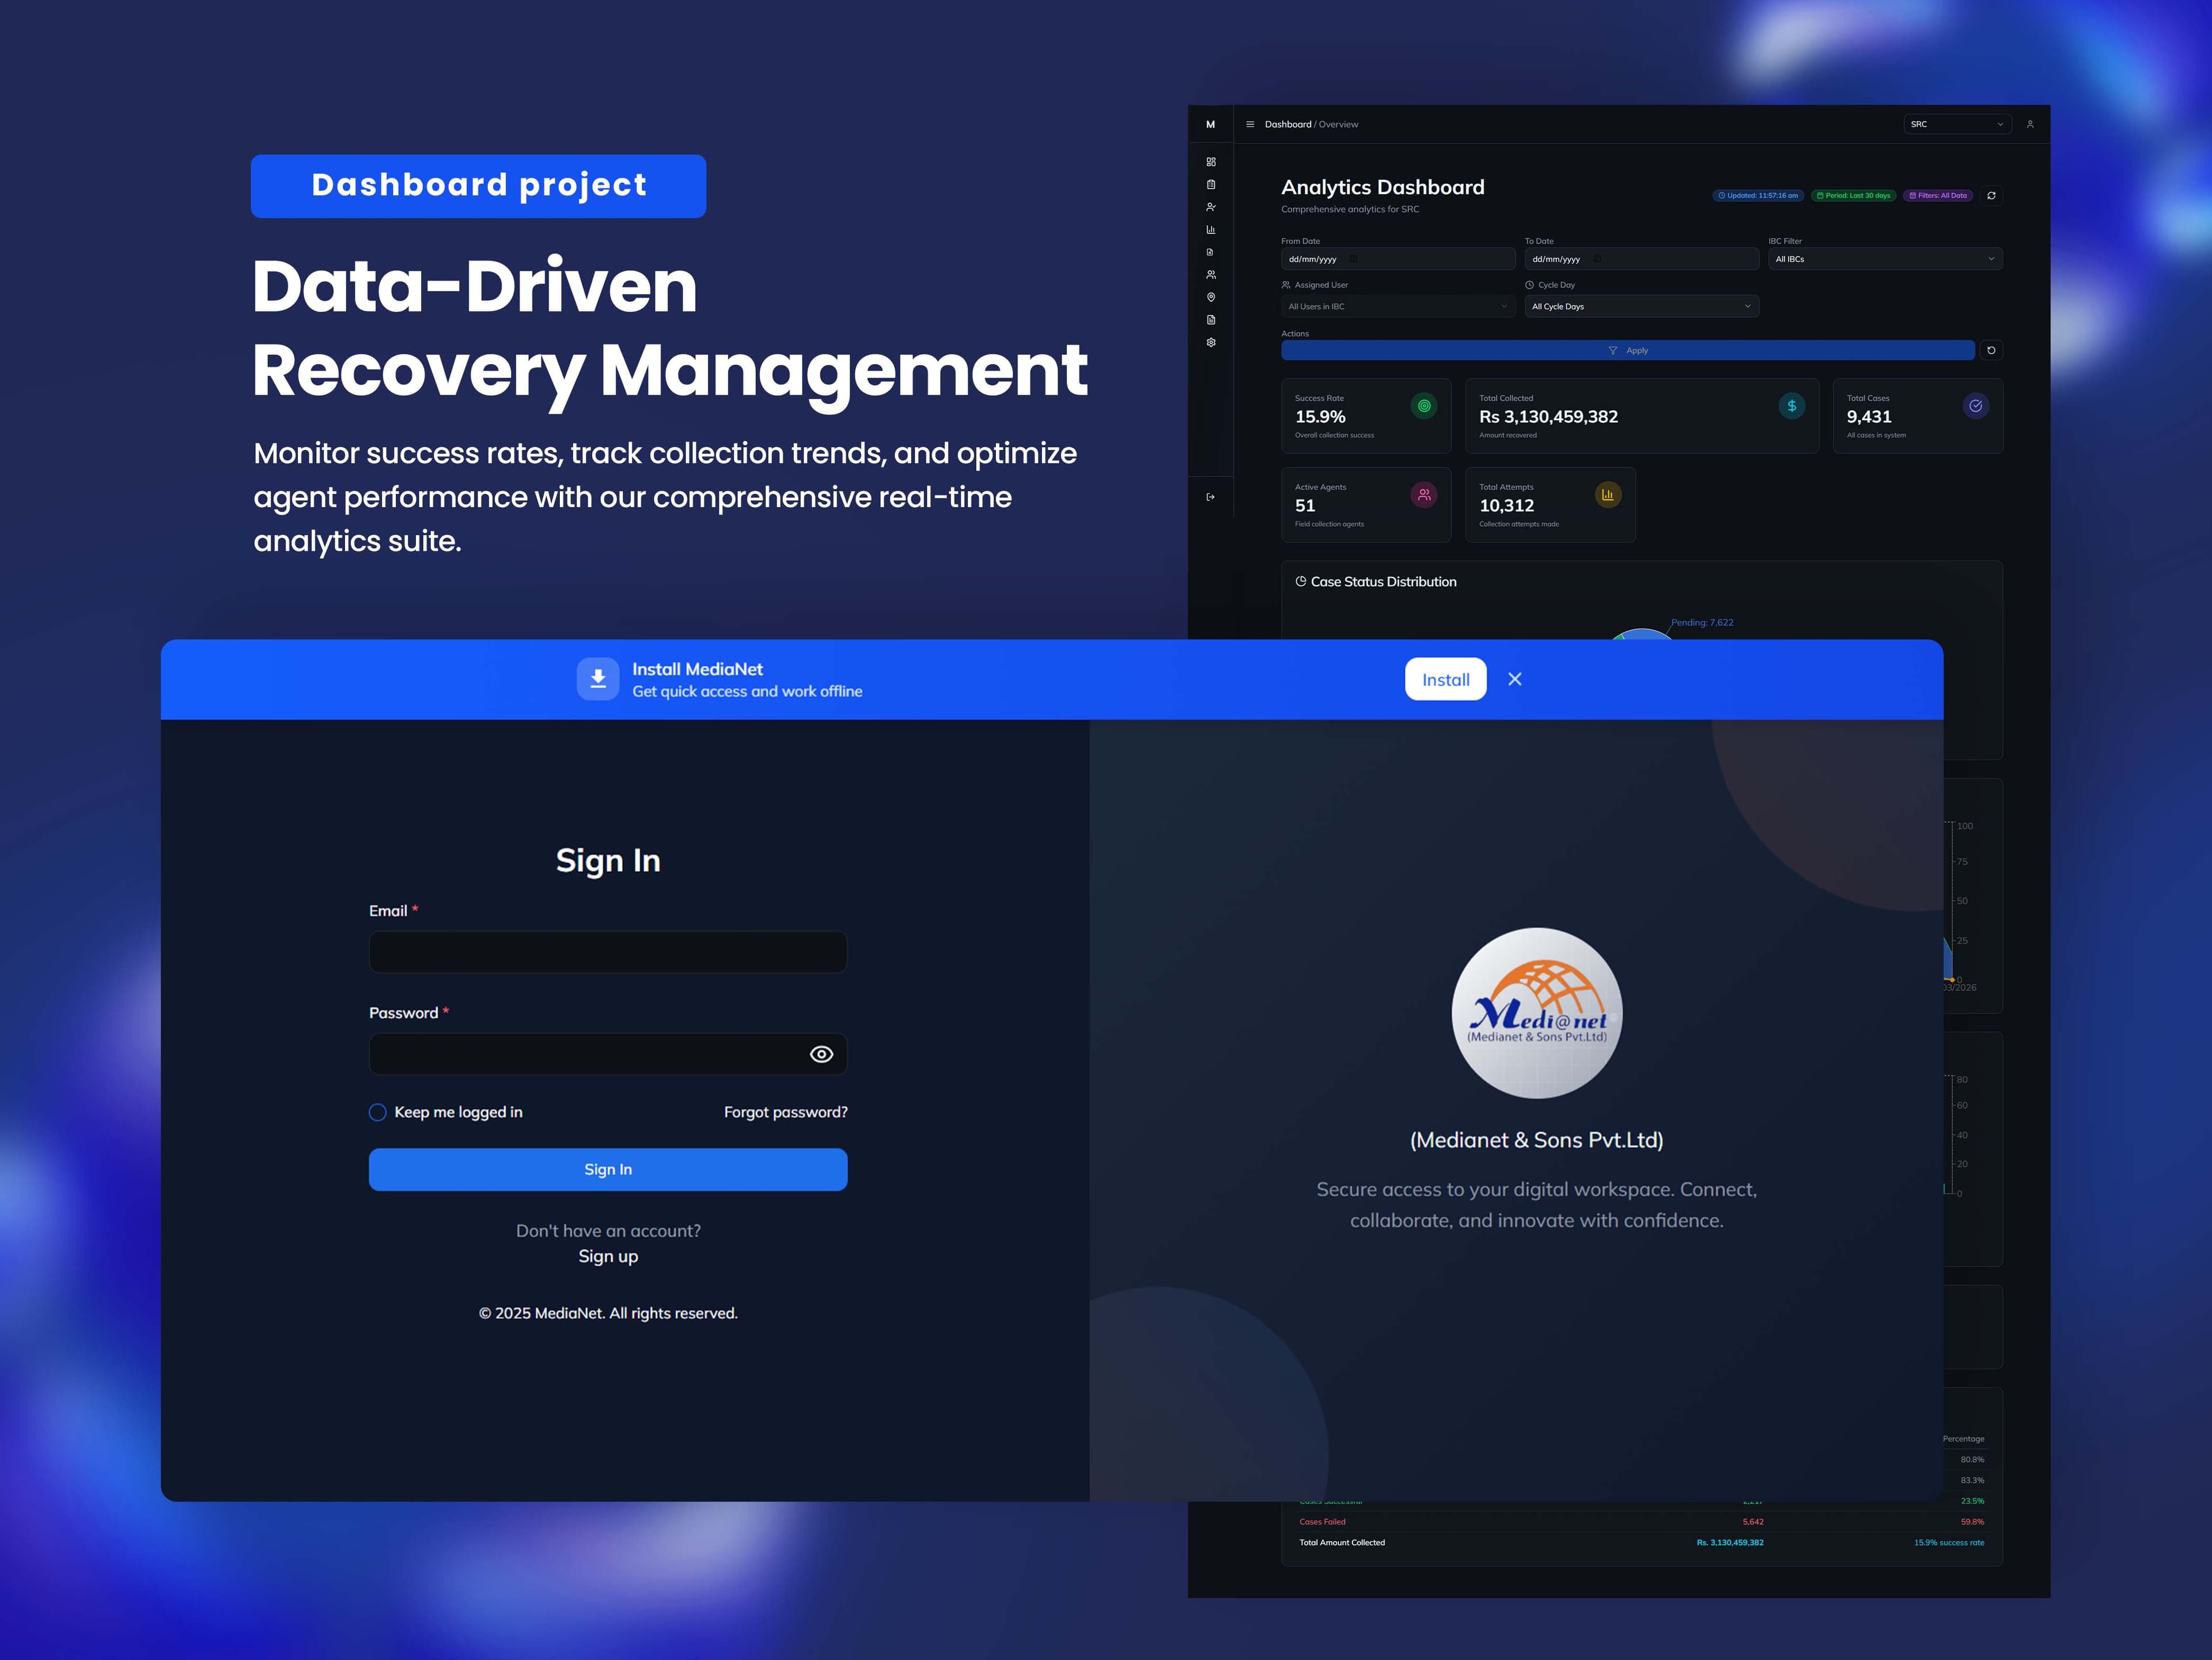
MediaNet is the operations platform behind Medianet & Sons, a recovery and collections business that runs large field teams across many branch offices. We built a single dashboard where managers can load case batches, watch collection numbers move in real time, track how each agent is doing, and see where their field staff are during the day. It replaced scattered spreadsheets with one place to run the whole recovery operation.
Industry
Analytics / Field Operations
Status
Live in production
The challenge.
The business processes thousands of recovery cases at once, spread across dozens of branch offices and hundreds of agents. Cases come in as CSV uploads, get grouped into batches, assigned to officers, worked over a due cycle, and reported on. Before this platform there was no shared view of any of it. Managers could not easily see success rates, how much had been collected, which agents were performing, or where field teams were. The data lived in files and was always out of date by the time anyone read it.
What we built.
We built one analytics and operations dashboard that covers the full case lifecycle. Cases get imported through batch uploads, assigned and transferred between officers, and tracked against due dates and progress. On top of that sits a real-time analytics layer with success rates, total collected, case status breakdowns, collection trends, and per agent performance. A live tracking view shows where field staff are. Everything reads from the same data so the numbers a manager sees are current, not a report from yesterday.

Case Operations
Batch management for thousands of cases
The core of daily work is the Batch Management screen. Cases arrive as CSV files, get grouped into named batches, and are assigned to a branch office with a priority and a due date. Each batch shows a live progress bar with good, bad, and total counts so a manager can tell at a glance how far along the work is. The dashboard was tracking 337 batches and over 7,000 cases in the view we captured.
- CSV upload flow to create and assign case batches
- Progress bars with good, bad, and total counts per batch
- Priority and due date tracking across every batch

Analytics
Real-time numbers on the whole operation
The Analytics Dashboard pulls the operation into one screen. Success rate, total collected, total cases, active agents, and total attempts sit across the top as live tiles. Below that, a case status pie chart splits pending, attempted, successful, and failed cases, a collection trends chart plots money recovered over time, and a top agent chart ranks performers. The same screen also handles case transfers, moving assignments between officers in the same branch.
- Live metric tiles for success rate, collected amount, and active agents
- Case status, collection trend, and agent performance charts
- Case transfer between officers with role and date filters

Administration
Users, roles, and file processing
Running an operation this size means managing a lot of people and a lot of files. The IBC User Management screen handles user assignments across branch offices and a reserve pool, with role filters for recovery officers and active or inactive status. Files Management tracks every import and export with its status, progress, record count, and timestamp, so nothing gets uploaded twice or lost.
- User and role management across branch offices and a reserve pool
- Role based filtering for recovery officers and other staff
- Import and export tracking with status, progress, and record counts
The Product
One platform for data-driven recovery
All of this lives behind a single secure login for Medianet & Sons. The product brings batch operations, real-time analytics, user administration, and live field tracking together so the whole recovery business runs from one place. Managers monitor success rates, follow collection trends, and check agent performance without leaving the dashboard.
- Single secure portal for the entire recovery operation
- Real-time analytics tied to live operational data
- Live location view for field operations teams
How we built it.
The path from first conversation to a production system.
Mapped the case lifecycle
We walked through how a case moves from CSV upload to batch, assignment, attempts, and final status, so the data model matched the real recovery workflow.
Built the operations core
Batch management, case transfers, and user and role administration came first, since these are what the team touches every day.
Added the analytics layer
On top of the live data we built the dashboard with metric tiles and charts for success rate, collections, case status, and agent performance.
Wired in live tracking
A maps based view was added so managers can see field staff locations during the day, then the whole thing was shipped to production.
The results.
What MediaNet delivers in production, and the core stack it runs on.
Thousands of recovery cases managed across batches and branch offices in one view.
Success rates, collection trends, and agent performance update from live operational data.
A maps view shows where field operations staff are during the working day.
The platform runs the day to day recovery operation for Medianet & Sons.
Have a project like this?
Tell us what you're building. We'll come back with a clear plan, a timeline, and the team to ship it.